Exposing the Kubecost Dashboard to a Public Network: A Practical Guide!
Managing your Kubernetes costs with Kubecost is great, but now you need to expose its dashboard to a public network. Here are two ways to achieve this — but which is the better option? Let’s explore both while keeping things fun, formal, and safe!
Option 1: The LoadBalancer Approach — Quick but Costly
Picture this: you’re running Kubecost and decide, “Let’s expose the service with a LoadBalancer. Easy-peasy!” Sure, it’s fast and simple, but there’s a catch (and a pretty big one).
Dedicated LoadBalancer: Kubecost’s "KubeAnalyzer" service will get its own LoadBalancer, which is awesome for simplicity.
Costs Add Up: But wait—this means you’re paying for each service with its own load balancer! For your wallet, this is not ideal.
Exposed to the Public: You’re also exposing the service directly to the public internet. Yikes! From a security standpoint, that’s not the best idea.
So, while it’s convenient, this approach comes with added costs and potential security risks. Think of it like opening your front door and letting in all the traffic — not everyone is invited!
Option 2: Kubernetes Ingress with NGINX — A Safer Bet
Now imagine this: you’re running multiple Kubernetes services, but instead of assigning a load balancer to each one, you route all traffic through a single Ingress controller.
Ingress Controller as Traffic Manager: It’s like having a bouncer for your deployment. You’ll use an Ingress controller (NGINX) to route all traffic.
One LoadBalancer to Rule Them All: You only need one LoadBalancer for the Ingress controller, and all your services will remain safely tucked behind Cluster IPs (private IPs). This saves money!
Better Security: By using NGINX as a proxy, you’re controlling what traffic comes in and who gets to see your Kubecost dashboard. Plus, your services aren’t directly exposed to the wild public internet.
In this setup, public traffic is managed smartly and only the necessary traffic gets to your service. It’s cost-effective, scalable, and secure — think of it like having an awesome security team at the door!
Lets explore both options:
Option 1: The LoadBalancer Approach — Quick but Costly
As mentioned before it is straight forward and easy.
Get the service name of the “KubeCostAnalyzer“
kubectl get service -n kubecost
Now that we have the name, let’s edit the service to use a LoadBalancer.
Run the following command to open the editor for the
kubecost-cost-analyzerservicekubectl edit service kubecost-cost-analyzer -n kubecost
In the editor, locate the
"type"field under"spec"and change its value from"ClusterIP"to"LoadBalancer". Once done, save and exit the editor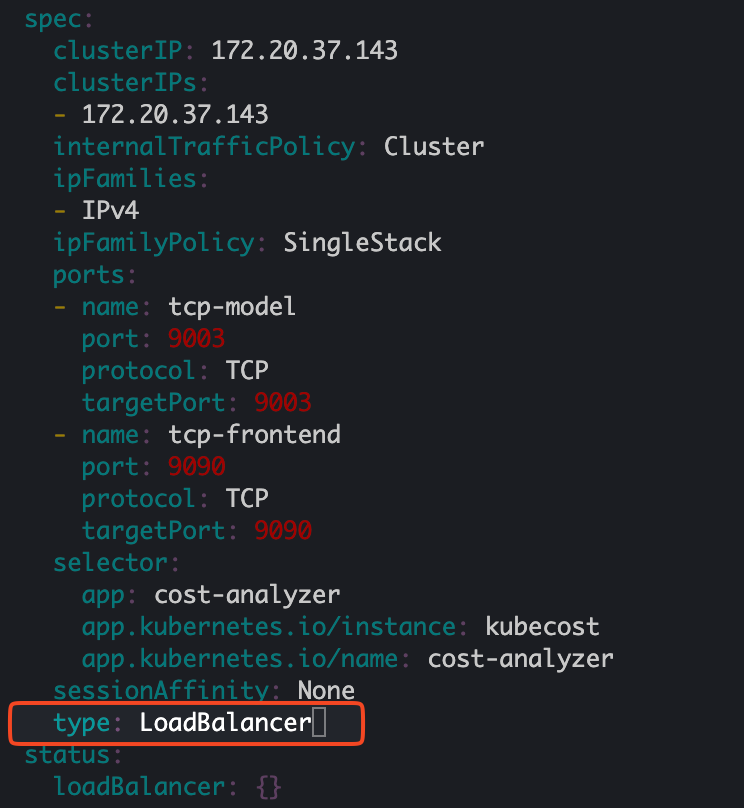
That's it! You can now access Kubecost using the URL provided under the External IP section.
Run the following command
kubectl get service -n kubecostYour “
kubecost-cost-analyzer" service will have an external url. You can directly use it to load the kubecost dashboard
Since this method isn’t the best practice, let’s explore how to securely expose Kubecost using an Ingress controller.
Option 2: Kubernetes Ingress with NGINX — A Safer Bet
We’ll be using Ingress with NGINX as our trusty proxy. Let’s dive into how we’ll configure this Ingress for our EKS cluster, making things both secure and efficient
- Pre-Requesites:
Installing Kubectl
- If you don’t have kubectl installed, use the steps provided in this link.
Installing Helm
To install Helm
    curl -fsSL -o get_helm.sh https://raw.githubusercontent.com/helm/helm/main/scripts/get-helm-3
    chmod 700 get_helm.sh
    ./get_helm.sh
Update KubeConfig to access your cluster via Kubectl:
  export CLUSTER_NAME="<YOUR CLUSTER NAME>"

  #Update KubeConfig
  aws eks update-kubeconfig --name ${CLUSTER_NAME} --region ${AWS_REGION}

  #Check whether you can able to connect to cluster
  kubectl get pods
- Installing Ingress-Controller
Add Ingress Helm repo
helm repo add ingress-nginxhttps://kubernetes.github.io/ingress-nginx
Install Ingress
helm install my-nginx ingress-nginx/ingress-nginx \ --namespace ingress-nginx \ --create-namespace \ --set controller.metrics.enabled=true \ --set-string controller.metrics.service.annotations."prometheus\.io/port"="10254" \ --set-string controller.metrics.service.annotations."prometheus\.io/scrape"="true"controller.metrics.enabled=true» This flag enables metrics collection on the NGINX Ingress controller. Metrics provide insight into the performance and operation of your ingress controller, such as request rates, response times, etc.prometheus.io/port: "10254"» Specifies the port where the metrics will be exposed. In this case, Prometheus will scrape metrics from port10254on the NGINX controller.prometheus.io/scrape: "true"» This tells Prometheus to scrape (i.e., collect) metrics from this service. It’s essentially saying: "Yes, Prometheus, please gather data from here."
- Post Installation Checks:
Checking the NGINX-INGRESS Deployment
kubectl get all -n ingress-nginx
- Configuring Kubecost Traffic Routing Through Ingress for Public Access
Create a file called ingress-kubecost.yml and copy the below content
  apiVersion: networking.k8s.io/v1
  kind: Ingress
  metadata:
    name: kubecost-ingress
    namespace: kubecost
    annotations:
      nginx.ingress.kubernetes.io/rewrite-target: /
      kubernetes.io/ingress.class: nginx
  spec:
    ingressClassName: nginx
    rules:
    - http:
        paths:
        - path: /
          pathType: Prefix
          backend:
            service:
              name: kubecost-cost-analyzer
              port:
                number: 9090
Then run the following command to install the manifest on kubecost namespace
kubectl apply -f ingress-kubecost.yml
Checking the deployed manifest
kubectl get ingress -n kubecost
Voilà! Kubecost is now successfully configured to route traffic through the Ingress for public access. Simply use the URL provided in the Address section to launch your Kubecost dashboard and start monitoring!
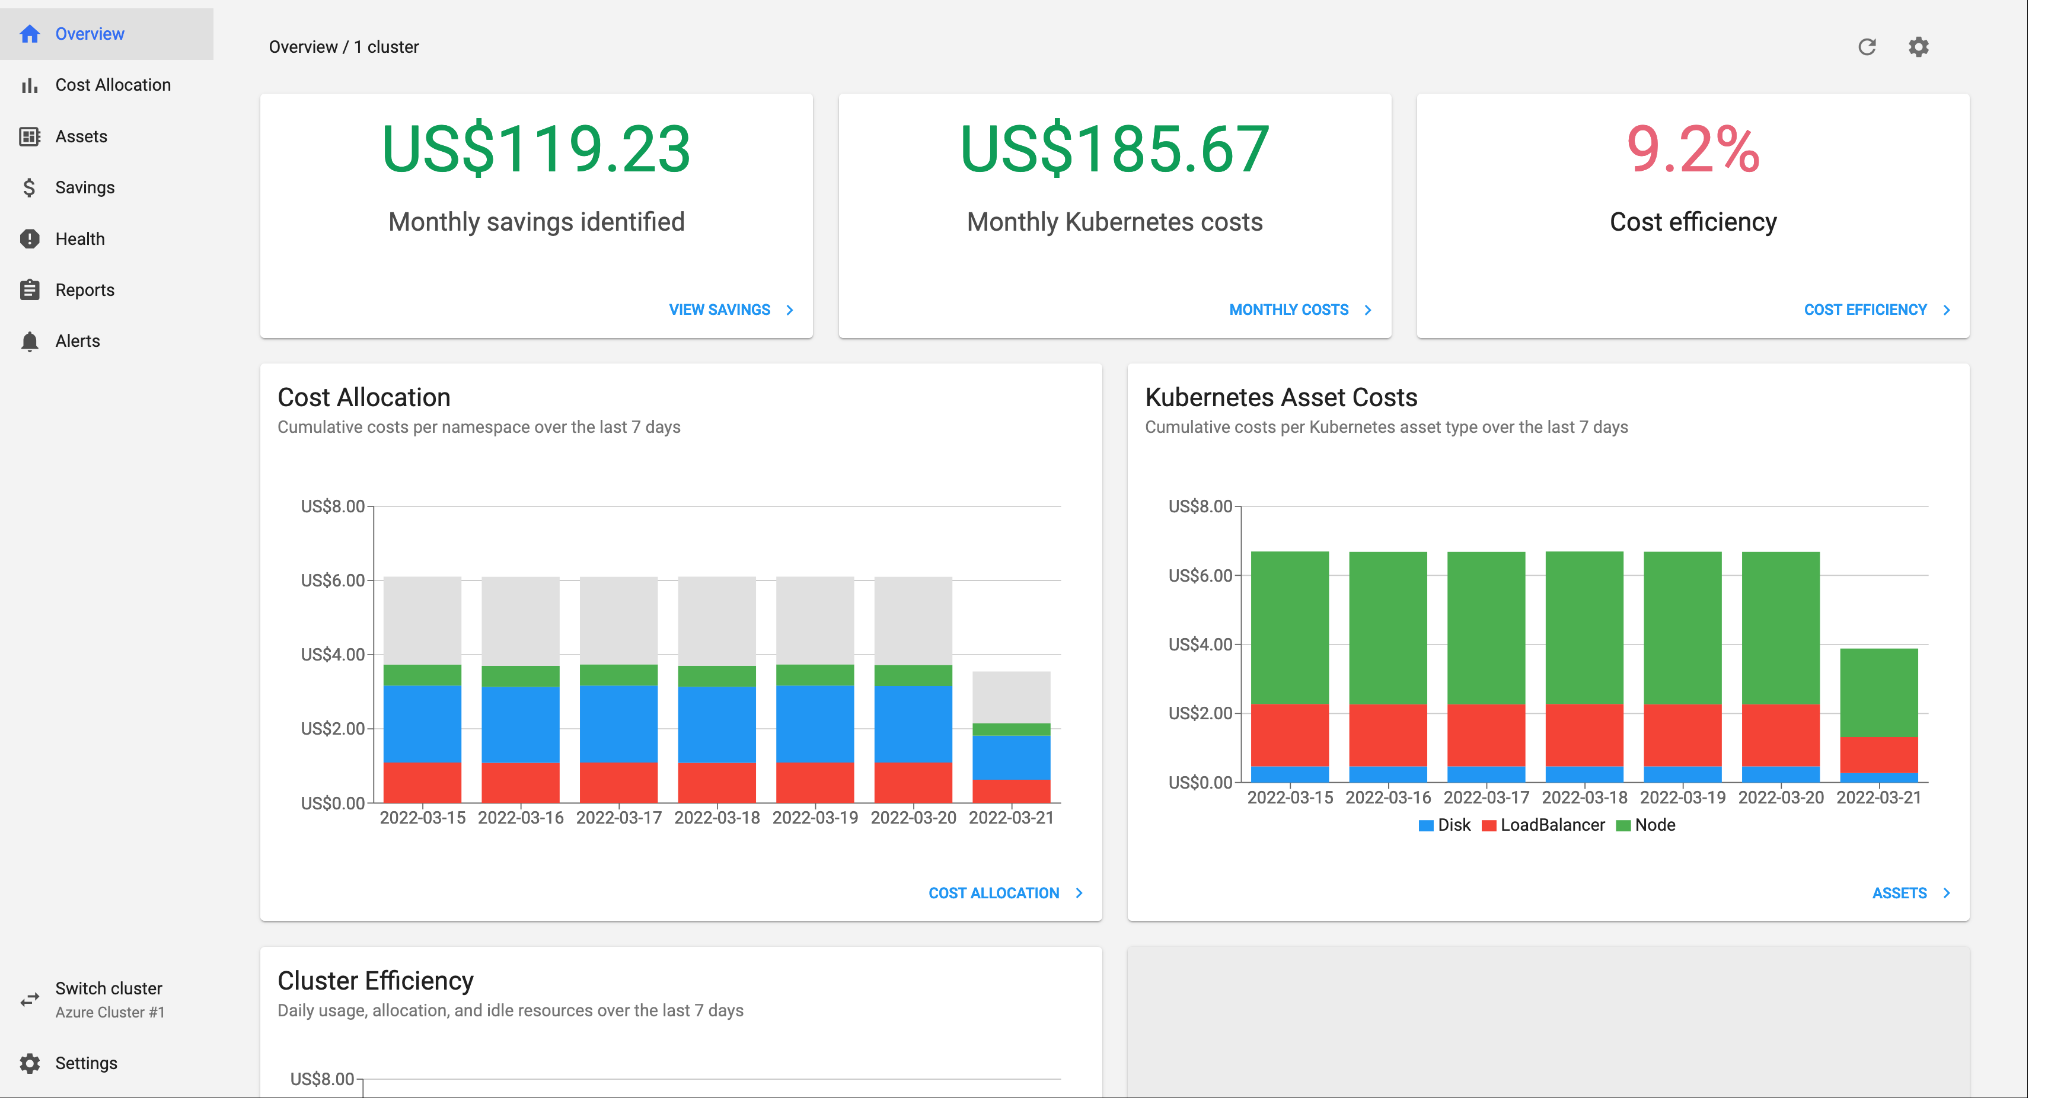
Sample Dashboard:
Credits:
I would like to express my gratitude to the following sources that provided invaluable insights and references in the creation of this blog:
Feedback & Clarifications
I hope you found this guide helpful! If you have any questions, need further clarification, or spot any corrections, feel free to leave a comment below. I’d love to hear your feedback and will be happy to assist with any concerns or improvements! 😊
